Introduction
Understanding how to read a profit and loss statement is a critical skill for entrepreneurs, business owners, and financial managers. Because this document encapsulates your company’s financial performance, it directly influences your decisions around spending, pricing, forecasting, and growth. Furthermore, it highlights your business’s strengths, exposes its weaknesses, and offers insights that are otherwise hidden in daily operations. So, if you’re serious about financial clarity, learning to dissect this document is non-negotiable.
What Exactly Is a Profit and Loss Statement?
A Profit and Loss Statement (P&L)—also called an income statement—is one of the three fundamental financial statements used in business accounting, alongside the balance sheet and cash flow statement. It summarizes revenues, costs, and expenses over a specific time frame, usually monthly, quarterly, or annually. Consequently, it provides a clear picture of whether your business is profitable or losing money.
Unlike a balance sheet, which shows your business’s assets and liabilities at a given point, the P&L shows the journey—your earnings, expenses, and what’s left over after everything is paid. Therefore, it’s more than just numbers; it’s a story about how your business performs over time.
1. Revenue Recognition: The Top Line
At the very top of the P&L is revenue, also known as sales or gross income. This figure represents all the income your business brings in from selling products or services before any costs or deductions. As a result, it’s commonly referred to as the top line—because it sets the tone for every calculation that follows.
Understanding your revenue is the first step toward financial clarity. But be mindful: not all revenue is created equal. Recurring income, like subscriptions or contracts, is far more stable than one-time sales. For service-based businesses, recognizing when a service is “earned” versus when it’s “billed” can affect how you perceive performance.
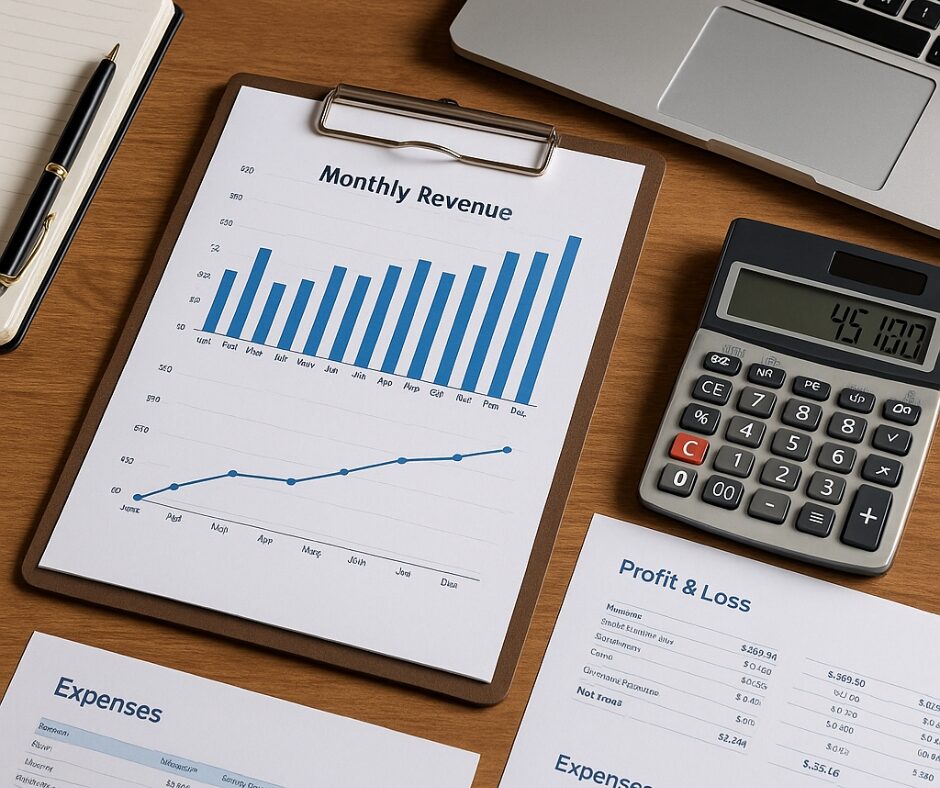
Tip: Track trends in your revenue across months or quarters to identify peak periods or dips—these can help with inventory planning, staffing, and promotions.
2. Cost of Goods Sold (COGS): What It Takes to Make It
Next, you’ll subtract COGS—the direct costs of producing goods or delivering services. This includes raw materials, labor, and any costs that vary with production volume.
For example, if you own a T-shirt company, COGS includes the fabric, ink, labor to print, and packaging. However, office rent or marketing costs would not be included here—they belong under operating expenses.
The relationship between revenue and COGS gives you gross profit, which we’ll cover next. But for now, understand that this line tells you how efficiently you’re delivering your product or service.
Tip: Keep an eye on rising material or labor costs. An increase in COGS without a matching revenue increase can erode profitability fast.
3. Gross Profit: A Measure of Efficiency
By subtracting COGS from your revenue, you arrive at gross profit. This figure reveals how efficiently your business is producing or delivering what you sell. It also reflects your pricing strategy—because if your pricing doesn’t account for production costs, you’re setting yourself up for failure.
The formula is: Gross Profit = Revenue – COGS
Gross profit is also the first checkpoint to assess your gross margin—which is the percentage of revenue that remains after production costs.
Tip: A high gross profit means you have room to invest in marketing, staff, or operations. A low gross profit may indicate the need for pricing adjustments or cost-cutting measures.
4. Operating Expenses: Keeping the Lights On
After gross profit comes operating expenses, also known as OPEX. These are the costs associated with running your business day to day. They are not directly tied to making or delivering your product or service, but they are essential.
Examples include:
- Rent or mortgage for office space
- Salaries for administrative staff
- Software subscriptions
- Utilities
- Advertising and marketing
- Insurance
Understanding and tracking these costs is crucial. As your business scales, operating expenses can balloon—often without direct correlation to revenue. Therefore, monitoring this category ensures your business stays lean and agile.
Tip: Break down expenses into fixed and variable to better understand which costs scale with your business and which remain constant.
5. Operating Income: What’s Left After Running the Business
Once you subtract your operating expenses from your gross profit, you’re left with operating income (also called operating profit or EBIT—earnings before interest and taxes). This figure shows how much profit your core operations generate without the influence of non-operational income, interest, or taxes.
This is one of the most powerful figures in your P&L because it reflects the health of your business engine. If operating income is low or negative, it’s a sign that your business model needs re-evaluation.
Tip: A consistently strong operating income can attract investors or prepare you for scaling, franchising, or expanding into new markets.
6. Other Income and Expenses: The Non-Core Stuff
The next section of the P&L includes non-operating income and expenses. This could involve:
- Interest earned on bank accounts
- Gains or losses from investments
- Lawsuit settlements
- One-time purchases or donations
These items don’t represent your usual operations, but they still impact your net income. They can be either positive or negative and are usually unpredictable.
Tip: Keep these items separate in your mind when making decisions—they don’t reflect your actual business operations, and planning around them can be risky.
7. Net Income: The Bottom Line
Finally, we reach net income—the bottom line of the business. This is what remains after subtracting all expenses, including taxes and non-operating costs. It’s the clearest indicator of whether your business is profitable or not.
If it’s positive, your business is earning more than it spends. If it’s negative, you’re operating at a loss, and adjustments are needed.
Tip: Use your net income to calculate key metrics like profit margin, ROI, and earnings per share if applicable. Net income is also used when filing taxes or seeking loans.
8. Cash Flow Impact: What the P&L Doesn’t Tell You
While a profit and loss statement shows profitability, it doesn’t show cash flow—which can be just as important. A business can be profitable on paper and still run out of cash if receivables are delayed or expenses come due too soon.
Therefore, pair your P&L review with a look at your cash flow statement to ensure your business is financially stable.
9. Profit Margins: The True Gauge of Performance
To go deeper, use your net income and revenue to calculate net profit margin:
Net Profit Margin = (Net Income / Revenue) x 100
This tells you how much profit you’re making for every dollar of sales. It’s a powerful comparison tool across months, quarters, or even competitors.
A business with $10,000 in revenue and $2,000 in net income has a 20% profit margin—meaning 20 cents of every dollar earned is actual profit.
Tip: Aim to improve your margin by optimizing costs, increasing pricing, or improving customer retention.
Final Thoughts
Knowing how to read a profit and loss statement transforms you from a business operator into a strategic thinker. Every line on this statement tells a story—of growth, efficiency, and financial health. By reviewing it monthly or quarterly, you gain the insights needed to adjust course, double down on what’s working, and trim what’s not.
In today’s fast-paced world, clarity is power. So take charge of your numbers—because no one will care about your bottom line more than you.