If you’ve ever stared at your bank account and wondered where all your money went, you’re not alone. For many entrepreneurs, finances can feel like a game of whack-a-mole. One moment, you’re flush with income. The next, you’re dealing with surprise expenses, inconsistent cash flow, or unexpected shortfalls. The good news? There’s a way to gain control—and it doesn’t require expensive software or a finance degree. All you need is a spreadsheet.
Spreadsheets for financial planning might sound old-school, but they’re still one of the most powerful tools in an entrepreneur’s toolkit. They provide unmatched clarity, customization, and control, which are essential when you’re building a business and managing money with intention.
Let’s take a deep dive into how to truly unlock the full potential of spreadsheets for financial planning.
Why Spreadsheets Still Matter in 2024
In a world filled with budgeting apps, fintech dashboards, and real-time sync tools, why do spreadsheets still matter?
Because no app knows your business better than you do.
Apps are built on pre-set templates and assumptions. Spreadsheets? They’re a blank canvas. That means you decide how to organize your data, what KPIs matter most, and how deep you want to go with your analysis. You’re not stuck with someone else’s logic. You’re creating your own financial language.
Early in my entrepreneurial journey, I tried out a few apps. They were great in theory, but they always left me feeling boxed in. Then I opened a new tab in Google Sheets and decided to build my own budget tracker. It wasn’t perfect, but it was mine. And for the first time, I saw my business with fresh eyes. Profits. Waste. Opportunities. Risks. All laid out right in front of me.
Spreadsheets bring your finances out of the shadows.
Full Customization: Your Business, Your Rules
Let’s say you run a service-based business and want to break down your revenue by client, project, and month. Good luck doing that in most budgeting apps.
With spreadsheets, you can:
- Create separate tabs for each income stream
- Assign categories that actually make sense for your business
- Include detailed columns like “Expected Close Date,” “Paid Status,” or “Notes”
- Customize formulas for calculating taxes, profit margins, or billable hours
This level of personalization can make the difference between a reactive business and a proactive one. You’re not just tracking money. You’re building systems that help you make better decisions.
Real-Time Visibility: See the Big Picture at a Glance
When you update your spreadsheet manually (or semi-automatically with tools like Tiller), you’re engaging with your numbers consistently. You’re not relying on a delayed sync or vague categories. Instead, you’re facing the financial truth of your business in real-time.
Want to know how much runway you have? Check your monthly balance tab.
Need to review spending habits? Filter your expense log by category and date.
Curious about ROI from a recent campaign? Pull up your marketing cost column and match it to revenue.
Real-time visibility gives you the confidence to act—not guess.
Better Decision-Making: Forecasting with “What-Ifs”
One of the most underrated uses of spreadsheets is scenario planning.
Using simple formulas, you can plug in different outcomes and immediately see the effect:
- What if your contractor rates increase by 10%?
- What happens to your net income if a client delays payment?
- Can you afford to hire a new employee this quarter?
These “what-if” simulations help you prepare for both risk and opportunity. You’re no longer navigating blind. You’re thinking ahead, supported by data.
This kind of strategic thinking separates successful business owners from those constantly putting out fires.
Easy Sharing & Collaboration: Keep Everyone on the Same Page
Spreadsheets aren’t just for solo use. They’re collaboration tools too.
With cloud-based platforms like Google Sheets or Excel Online, you can:
- Share live dashboards with your accountant or bookkeeper
- Provide real-time budget updates to business partners
- Let team members add expense details or updates on their roles
You control who sees what. You can set permissions, track changes, and even comment on cells for accountability. This level of coordination is critical as your business scales.
Building Data-Driven Habits: Why Manual Tracking Still Wins
Automated tools might seem more efficient, but when you enter your own data, something powerful happens. You slow down. You notice. You become intentional.
Every time you log an expense or update your income tab, you’re building financial awareness. That awareness leads to better habits—spending less impulsively, planning more accurately, and making sharper decisions.
In the same way athletes review their performance footage, entrepreneurs can use spreadsheets to review their financial “game film.” It’s not about perfection. It’s about progress through consistency.
How to Build a Financial Planning Spreadsheet That Actually Works
If you’re starting from scratch, here’s what I recommend including in your sheet:
1. Income Tracker
Include fields for:
- Client name or income source
- Invoice amount
- Payment date
- Status (pending/paid)
- Notes for irregularities
2. Expense Log
Break down:
- Date of purchase
- Category (marketing, operations, software, etc.)
- Amount
- Vendor
- Payment method
- Recurring or one-time flag
3. Budget vs. Actual
Build two columns:
- Projected (based on your planned budget)
- Actual (based on your real transactions)
Add a variance column to help you spot patterns—both good and bad.
4. Monthly Summary Tab
Roll up totals from your income and expense logs and calculate:
- Gross income
- Total expenses
- Net profit
- Savings/investments
- Business runway
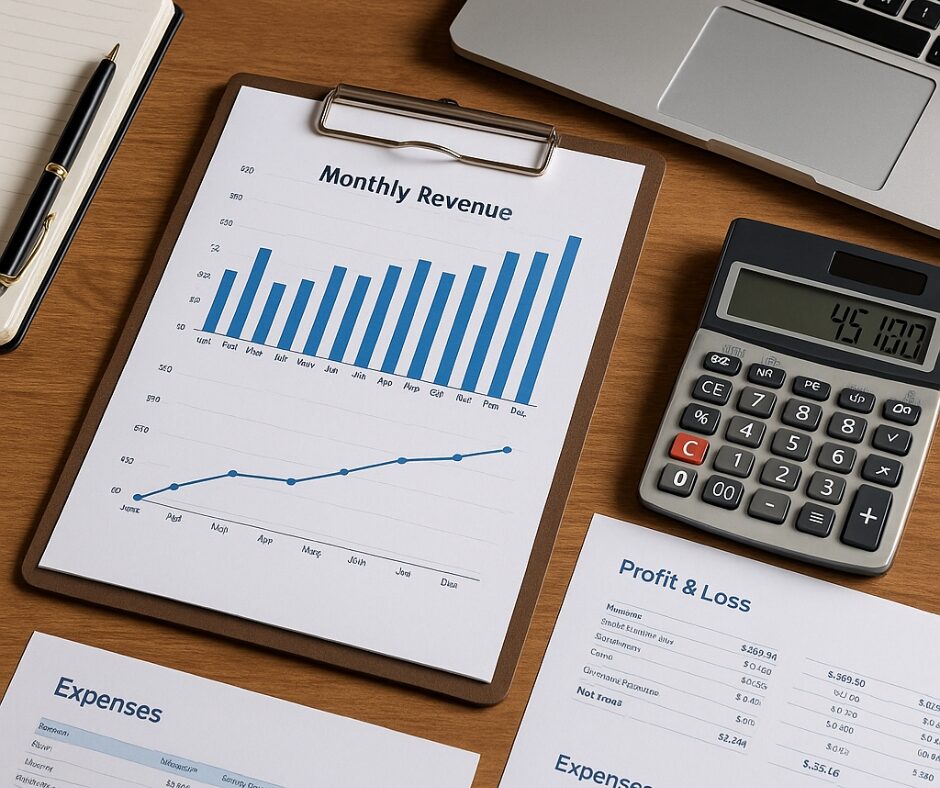
5. Visual Dashboard
Use bar graphs, pie charts, and trend lines to visualize where money is flowing.
Numbers tell the story, but visuals make you feel the message.
Spreadsheet Tools and Add-Ons to Explore
Here are some extras worth looking into once you’ve mastered the basics:
- Tiller Money – Links your bank feeds directly into Google Sheets. Great for semi-automation.
- Smartsheet – More robust project budgeting and tracking with team collaboration features.
- Google Data Studio – For advanced visual reporting built from your Sheets data.
- Notion + Simple Tables – If you prefer a more visual workspace with hybrid tools.
Final Thoughts: Master Your Numbers, Master Your Business
You don’t need to be a spreadsheet wizard to start. You just need to start. Create a simple tracker. Use it every day for a week. Then improve it.
Financial spreadsheets are more than rows and columns. They’re decision-making engines. They bring clarity to chaos, structure to stress, and foresight to your finances. And most importantly, they put you back in control.
If you can build a financial spreadsheet, you can build a better business.
Start today.